In previous posts, I’ve talked a little bit about comparing implied volatility to historical/realized volatility as well as implied volatility to itself. That’s all well and good, but how do we go about actually doing it? I’m a very visual guy, so I cooked up a very simple indicator for my platform (TDA’s ThinkOrSwim) that allows us to see both comparisons cleanly in one window. All I did is take TastyTrade’s IV rank indicator and add the following to the beginning of the ThinkScript:
plot historical= reference historicalvolatility(45)*100;
historical.SetLineWeight(2);
When we put that all together, we get a very powerful study that shows us the current implied volatility compared to the 45 day historical volatility, as well as the current IV rank and IV percentile, which in different ways describe the implied volatility versus itself. I picked 45 days for the HV plot as it is halfway between the 30 and 60 day window I want to use for our options trades. Once you have this study set up, it’s trivial to change that window or add 5, 15 or 30 day HV plots to get a more thorough volatility picture.
Our charts for each of the 10 underlyings we picked earlier look like this:
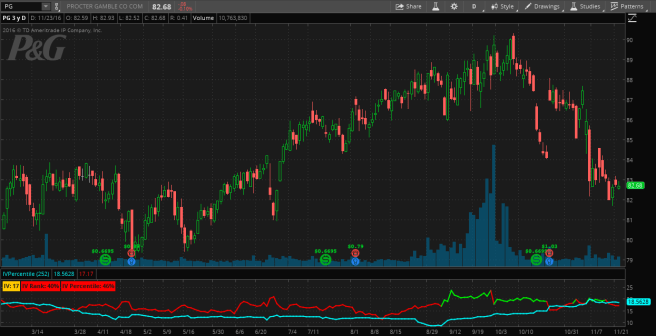
The price chart is “naked,” meaning void of any technical indicators or S&R levels, and the bottom pane shows 45 day HV (blue line) vs implied volatility, which is colored green when elevated and red otherwise. This simple setup allows us to identify opportunities before we switch over to the options chain and start constructing trades.
In addition to the straight IV/HV and IV/IV comparisons, we will also look at volatility skew. Contrary to what many models predict, (implied) volatility is not the same across strike prices. If it was, we would expect to see a flat IV vs. Strike plot. Instead, we see the following plot for PG calls, which can be found in ToS under Charts–>Product Depth:
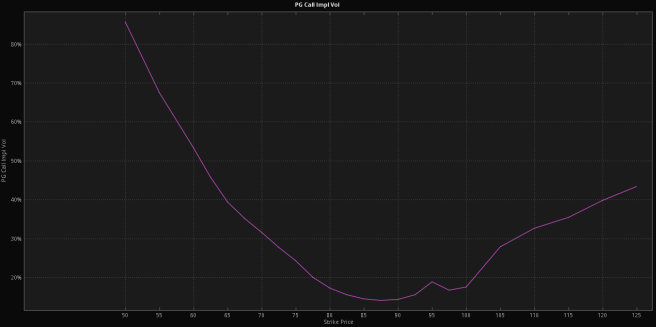
This shows us that ATM call IV is lower than OTM call IV, and much lower than ITM call IV. While not terribly interesting in and of itself, we can use these charts to examine when, for example, put IV is richer than call IV, and help us make the best trades given a general volatility assumption.
Between the options chain, our special IV vs. HV / IV vs. IV study, and IV curves, we now have everything we need to start identifying opportunities and placing trades.
