Slow and Steady

EOW 3 NLV (AH): $2293.89 (-206.11/-8.2%)

In a previous post I talked about buying more vol in AAPL and bought a put backratio spread in the hopes that IV would start to tick up. Since then, the stock has gone up almost 5% and IV is only a point or two higher. The vega of the long legs dropped as they moved farther OTM and as a result our position vega got cut nearly in half. I’m still of the opinion that IV in AAPL is significantly underpriced, and decided to roll the spread up and out to the 109/113 13Jan put backratio (+2/-1) to the 115/120 20Jan for $0.69 credit. This had the dual benefit of moving our breakeven prices up several dollars and get long more vega (~18 vs 9 before adjustment). I don’t normally like to take on more risk with a roll ($3 wide rolled to $4 wide) but I felt the credit taken in combined with extra duration and more favorable vega exposure made it worth it.

Later in the day I finally put a position on in BAC, selling 2 of the 20/21/25/26 27Jan17 iron condors for $0.25 a piece. For such a low credit — even less after commissions — it was a tough trade to construct, but the risk:reward of 3:1 is in line with what I shoot for and BAC IV has been floating just above its 50th percentile for a few weeks now.

Finally, I sold another IC in GLD to take advantage of the still-inflated IV, picking the 102/105/111.5/114.5 27Jan17 for $1.11. On entry the spread was almost delta neutral, short ~3.75 gamma and ~7.3 vega, and long 1.2 theta.

In other news, I’ve become very comfortable with our top 10 underlyings and decided to add two more to give us more opportunities. I stayed within CBOE’s top 20 stocks by option volume for November and settled on XOM (Exxon Mobil) and GILD (Gilead Sciences). These two stocks have very liquid option markets and give us exposure to two new sectors. Both are also decently priced stocks which is helpful.

  1. Roll 1 AAPL 109/113 13Jan17 –> 115/120 13Jan17 +2/-1 put backspread @ $0.69
  2. STO 2 BAC 20/21/25/26 IC @ $0.25 per
  3. STO 1 GLD 102/105/111.5/114.5 IC @ $1.11

Portfolio Greeks: -16.34Δ, -26.24γ, -10.87ν, 5.79θ

First Closed Trade

Week 3 NLV (AH): $2376.23 (-$123.77/-4.95%)

I apologize for the big gaps in updates…apart from a slow market, I’ve been pretty busy with real life the last couple weeks and trading has taken the back seat.

On the brighter side, I closed our first trade this week, the FB 125 put calendar. The strike selection on the calendar was very poor in that while it was cheap, there was too much dependency on a directional move for a volatility play. A strict vega play should have been placed closer to the money. I was trying to play the skew and in doing so lost sight of the reality that the stock still needed to move $6 in a couple weeks w/ steady vol or stay flat-ish with a huge volatility move to make a decent dollar profit. I got lucky when yesterday FB shot up ~$3 and I was able to sell the calendar for $0.41. Since we bought the cal for $0.27, that’s a gross $0.14, or around 50%. If you factor in commissions, it was bought for $0.30 net and $0.38 net. Not great, not bad, not a loser. I’ll take it for now. Small steps.

Despite the moves in gold and bonds after the fed meeting today, our short vega plays in BABA, GLD, IWM, PG, and TLT are slowly but surely starting to come in. PG and IWM are contributing a lot of short delta to the portfolio but with so much time still left I’m hesitant to make adjustments on those positions. The combined AAPL position is the big loser and I’ll be looking to make some adjustments to it early next week. AAPL is still sitting on the extreme low end of its IV range, and in order for this position to come in we need either a moderate move down in the stock or a tick up in IV towards the mean. In retrospect, I should have avoided trying to call the bottom in IV and waited for it to start riding back  up. Good lesson moving forward.

In other news, I’m considering replacing BAC in our top 10. It’s a cheap, relatively non-volatile stock that even with IV in the 73rd percentile presents very few attractive trades for us one-liners. I’m hard pressed to justify selling a 20 delta IC for $0.60 when the commissions are going to take $0.06 of that right off the bat.

BTC FB 23DEC16/06JAN17 125 put cal @ $0.41 (Open @ $0.27)

Russell Rally

Week 2 Net Liquidating Value (After Hours): $2376.32 (-$123.68/-4.95%)

It’s been a fairly slow trading week so far, which is both good and bad. Our short vol positions are starting to come in, but our long vol positions (FB and AAPL) haven’t seen IV creep up yet and are sitting flat or slightly negative. AAPL IV in particular got so low earlier this week (2nd percentile) that I decided to buy some more vol and put on a -1/+2 113/109 put backratio on the 13Jan17 weeklies for a credit of $0.16, adding around 15 vega to our position. On top of the double calendar we put on earlier, we’ve now got a strange looking position that is about -17 delta, long ~2 gamma, long ~19 vega, and roughly -2 theta. A nice side effect of the backspread was that it eliminated our downside risk below $110ish, but the main idea was taking advantage of the severely depressed IV in AAPL. Time will tell if we put this trade on too early, but as it stands we have 36 days for vol to come in.

The Russell 2000 (IWM) has had a monster rally this week, already exceeding the 1 s.d. implied move for the January 17 monthly expiry, and volatility has dropped accordingly. IV for IWM is now about 2-3 points lower than it was when we put our iron condor on last week. IWM’s rally poked above the short strike of the call half of our IC and I decided it was time to make an adjustment. Typically I would roll the put spread up to bring our position delta back in line, but the put vol dropped so much this week that rolling the puts up almost $10 was only showing a credit of around $0.30. With so much time left on the spread, the huge reduction in our downside cushion for that small of a credit didn’t seem to make sense. I also explored rolling the puts up to the 133/136 to make the position into an iron fly, but with IV so low, getting short that much vega didn’t make sense either.

So instead, I did something a little different that I’ve actually never done before. The put skew on IWM was so steep today that I was able to roll the long leg of the put spread from 120 to 122 for $0.12 debit including commissions, nearly eliminating our downside risk below $137.5 with very little change to our position greeks. Essentially, we paid $12 to take $200 of downside risk off the table. What we ended up with was a position similar to the BABA IC from last week. With so much time left on this spread (43 days), I’ll probably let it ride for a while and let the numbers play out. If the rally continues and IV continues to fade, we’ll take this one off for a loser. In any other price/vol combination, we might have some options.

As far as the rest of our portfolio goes, we’re pretty near flat. For losers we’ve got the IWM spread down 17% and the PG fly which has been up and down near 0 but is marked at -2% right now. For winners, the BABA and TLT IC’s are both up about 10% and the GLD IC is up almost 30% (IV got smacked). For I’m getting weird marks AH with the FB and AAPL positions but both were about flat at close today.

Portfolio Greeks

As we enter the second week of the project, it seems like a good time to take a look at our current portfolio greeks and make sure we have a plan moving forward. On an unweighted basis, we’re currently (as of Monday close) holding about -7 delta, -23 gamma, -29 vega, and +9 theta. I really don’t want to obsess over greeks since there’s not a whole lot we can do yet to fine tune them, but it’s important to keep in mind where our biggest risks are. We can see from the values about that ours are in convexity (gamma) and volatility (vega). What’s our worst case scenario? Overall, it looks like a large move coupled with a spike in volatility would blow us out. With equities volatility tends to move higher on down moves, so really we’re talking about a large down move resulting in higher volatility. This is the reason why we carry short delta when we’re short vega. Is -7 delta enough to balance -29 vega? To be honest, I’m not sure yet. We’ll find out together.

For the four trades we put on last week, from where I sit they seem to be coming in nicely. My aftermarket marks are a little goofy today but when the market was open PG IV was contracting, helping our short iron fly out, and TLT and GLD were both moving back towards the center of our short iron condors. IV for both is just starting to point down but is more or less where it was when we put those trades on, so for now we’re at the mercy of time and delta. IWM vol poked down a bit but the underyling moved against us a bit today so that position is down a few dollars so far. Those four still have 46 days until expiration and I won’t be touching them for a while.

We’ve still got around 30% of our buying power left, but I’d like to hold off on putting more positions on for a while. Going all in this early will put us in a corner if the market makes a large move one way or the other and will prevent us from taking advantage of big opportunities should they arise.

AAPL Double Calendar

Week 2 Start (Intraday): $2467 (-$33/1.32%)

Note: Will be using net liquidating value of account for P/L calculations moving forward. This should take into account commissions with the portfolio’s current mark-to-market. Was using the position total P/L value before which ignored commissions.

As part of a recent post I discussed the importance of diversification in strategy. The portfolio as of open this morning was all short vega trades: either short IC’s or iron flies. I figured today was as good a day as any to look into our top 10 and see if there were any opportunities to buy volatility. Buying vol can be tricky business; it can linger near or below its mean for longer than you might expect or want it to. When vol spikes it feels easier to time the sell since we know that, generally speaking, extremely high IV gets ironed out by the market pretty quickly. So I wanted to be careful and make sure not to buy vol just for the sake of buying it. Enter AAPL.

aapl

It might be hard to see in the screencap, but when this was taken AAPL’s 45 day realized volatility was sitting in the 2nd percentile and IV in the 13th percentile, with about a 4 point differential between the two. This seems like a good place to buy in some vol for two reasons, the first of which is that IV relative to itself is depressed. The second reason is that realized vol relative to itself is on the extreme low end, which implies we can expect to see a rebound at some point in the future, pushing IV with it.

So how do we go about buying vol? As with selling vol, we have a few ways of going about it. Debit spreads benefit from expanding vol (in that they widen), but come with more delta risk than I want right now. Backspreads have less delta risk but can be tricky to place when we need to keep strike width low. Buying strangles and straddles take on the most vol but are expensive, carry a lot of long gamma, and are short/negative theta. That leaves us with the calendar. Calendars are slow, weird animals that don’t pay much but offer a decent way for us to get long some vega without too much notional or directional risk.

With a calendar or diagonal we’re picking strikes across two different expiries, so it’s important to take a look at the term structure of the underlying before jumping into strike selection. To start, I tossed out the Jan’17 monthlies since I have enough exposure in that month. In keeping with the 30-60 day idea, I looked at the 6Jan17 and 13Jan17 weeklies (32 and 39 days respectively) for the long leg of the calendar. The 13Jan’s at 39 days actually had the lowest average IV of any expiration cycle available so that was a quick choice. For the short leg I went with the 23Dec16’s as the IV was about a full point higher and at 18 days gives us some time for the spread to work.

With a calendar the next step is strike selection. I wanted the most vega exposure I could get since this is a pure vol play so I looked for the best opportunity near the money. It happened to work out that IV in the Jan cycle happened to flatten out right near the ATM 109 strike on both the call and put side. I don’t want to buy already inflated IV in the hope it will inflate further, so I went with the ATM strike for the long leg. In the front week the IV curve is similar so I went with the ATM strike as well, trading the vega I lose from selling ATM with the directional risk I’d be taking on by selling OTM.

The final step is decided whether to sell a put or call calendar. Since ATM IV on both sides was just about the same (~15%) and the both spreads are fairly cheap, I went with both and put on a double calendar for a total debit of $1.05. The risk:reward ratio here is about 1.8:1, but I’ll be looking to take this off in the 25-50% profit range. If the stock moves quickly but IV inflates enough to roll the front week out for enough of a credit to justify the risk of holding the back month, I’ll explore that as well.

I know this was pretty long winded, but calendars are a lot more tricky to deal with than most people realize, including myself the first few times I traded them. They have very strange exposures and move very slowly sometimes. I’m hoping to manage this one in the next week or two.

Apart from that, I also put on an OTM call calendar in FB and sold an IC in BABA with uneven wing widths to sell some skew. Currently we’ve got 7 positions on in 7 of our 10 underlyings (all but BAC, SPY and QQQ).

Today’s Trades (greeks near open):

  1. BTO AAPL 23DEC16/06JAN17 109 dbl cal @ $1.05
    • D: ~0
    • G: -4.8
    • V: 6.3
    • T: 1.9 (note: long vega and theta)
  2. BTO FB 23DEC16/06JAN17 125 put cal @ $0.27
    • D: 4
    • G: 0.37
    • V: 3.19
    • T: 0.42
  3. STO BABA 13JAN17 80/85/97.5/99.5 IC @ $1.00
    • D: 5.8
    • G: -2.5
    • V: -5.6
    • T: 1.7


Diversification?

In traditional portfolio management, the investor will spread positions across different asset classes, stock sectors, or market cap to avoid a single event bringing down the entire portfolio. With options trading, we can diversify in similar ways, but we’re exposed to another variable that most stock traders aren’t: volatility. As volatility traders we’re exposed to volatility risk on purpose. We can diversify a volatility portfolio in four main ways: across assets, across time, across strikes, and across strategies. Concentrating trades in one asset class exposes us to macro events in that area and choosing only certain types of strikes and strategies can bring in new types of risk, such as gamma. But what about diversifying across time? To illustrate, let’s take a look at the term structure of volatility futures:

screen-shot-2016-12-02-at-1-11-40-pm

This is a fairly typical vol term structure, where the near term volatility future is trading lower than farther term futures (contango). This intuitively should make sense, as we are more uncertain about the market a year from now as we are a month from now. Sometimes, though, a market-shaking event can occur that causes front month vol to spike and the term structure to enter backwardation. If all of our trades are in one month, that’s where all of our vega risk is, and our entire portfolio is exposed to these types of events.

Where the portfolio currently stands, we’re using around half of our available buying power, all of which is in January options. While we’re fairly diverse in our asset classes (bonds, consumer goods, gold, and small-caps), strikes, and to a lesser extent strategies, I think we’ve got more than enough risk in January. Moving forward, we’ll look to place trades in a different expiration, as well as keep an eye out for long vega trades since all of our current trades are short vega.

PG Vol Play

Day 2 Account Value: $2497.5 (-$2.50/-0.08%)

It’s now been a couple days since I put the first two trades on, both of which are marked about the same as where they were placed. Taking a look at our Top 10 this morning, I wasn’t seeing anything interesting until I took a closer look at vol in PG. Realized vol is sitting in the 79th percentile and dropping, while implied vol is in its 68th percentile. More importantly I think is that IV just poked back above HV. With implied now overstating realized vol and thinking that realized vol may begin to trend back towards its long-run average, this looks like a good place for a straight vol selling play. Since ATM options carry the highest vega, I decided to put on an iron fly (capped straddle).

screen-shot-2016-12-02-at-12-16-46-pm

Since an iron fly is by definition selling a straddle and purchasing OTM legs to define risk, that only left the decision of how far OTM to go. Since the Jan’17 strikes are $2.50 wide and I want to keep our maximum risk per trade <10% of our account value for now, I could have gone either $2.50 wide (80/82.5/85) or $5 wide (77.5/82.5/87.5). Going only one strike out would have us buying in a lot of the vol we’re trying to sell with the ATM short strikes (reducing our net vega exposure), so I went with the $5 wide fly.

A little while later I sold a 120/123/136/139 Jan’17 iron condor in IWM to get an index play on. On entry those strikes were around 20 delta on the short side and 12 delta on the long side. Not particularly exciting.

Today’s Trades (greeks near open):

  1. STO 1 Jan17 PG 77.5/82.5/87.5 iron butterfly @ $3.00
    • Delta: -4.2
    • Gamma: -6.96
    • Vega: -9.45
    • Theta: 1.36
  2. STO 1 Jan17 IWM 120/123/136/139 IC @ $1.02
    • Delta: -6.02
    • Gamma: -2.23
    • Vega: -8.52
    • Theta: 1.33

Overall, the portfolio is net short delta/gamma/vega and long theta.

First Trades

Day 0 Account Value: $2500 (+$0/0%)

After all of our preparation and research, today was the day I laid out the first trades of our little experiment, selling iron condors on GLD (gold ETF) and TLT (U.S. Treasury Bonds ETF). I’ll walk through the thought process for only the TLT iron condor as the GLD spread followed similar logic. After open and into the afternoon, I had charts for each of our Top 10 underlyings open in the template I described in the previous post and examined volatility. For each of the ten, I asked the following: is implied volatility high, low or mid-range compared to itself, and is there a strong divergence or convergence of implied and historical volatility?

For the equity index ETFs SPY, QQQ, and IWM, implied volatility is mid-range and 3-4% above 45-day historical volatility. For now, I’m not finding that particularly interesting and I’ll pass.

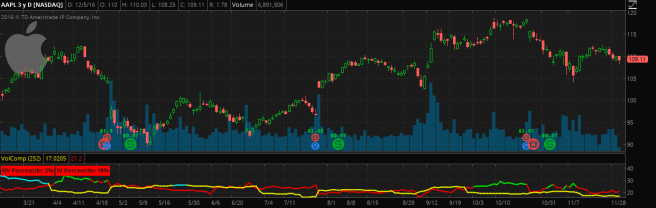
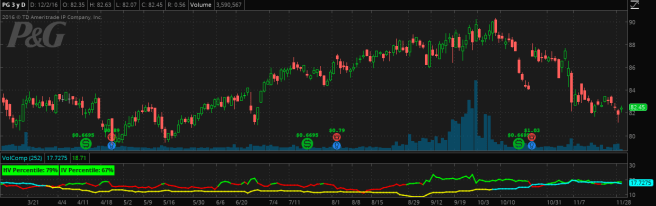
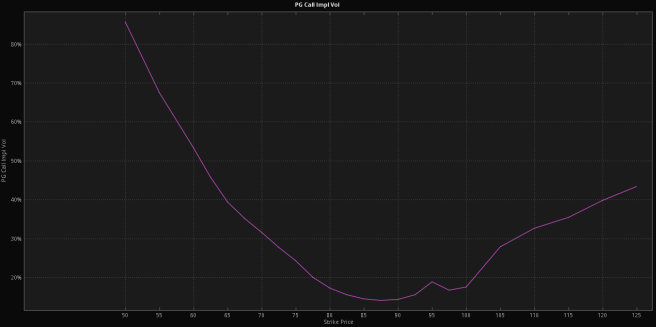
For our equity picks — AAPL, PG, BAC, FB, and BABA — implied volatility looks depressed (save PG at 60th percentile), but across the board is tracking historical volatility much tighter. An IV/HV spread of 1.1% on FB, for example, doesn’t give us much of an edge buying or selling volatility without trying to be predictive of the future. Keeping in line with our 30-60 day optimal expiry range, we’ll be looking at the Jan ’17 monthly options.

That left just two ETFs, GLD and TLT. Let’s examine the TLT setup:

screen-shot-2016-11-30-at-2-14-16-pm

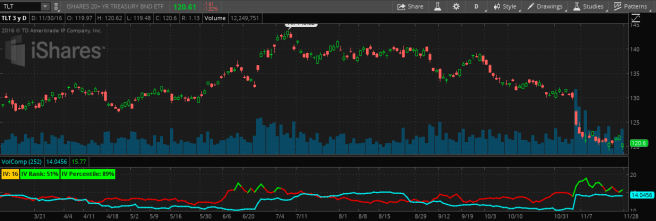
At the time the trade was put on, TLT was trading with a 89th percentile IV and a 1.7% IV premium over HV. IV is certainly inflated compared to itself, but what about that IV/HV differential? Until I find a clean way to compare HV to itself, I have to rely on qualitatively interpreting the HV (blue) graph. A quick glance shows that HV is nearly as high as its been over the past year. With both IV and HV near the top of their ranges, I’m inclined to believe both will trend down towards their long-run averages and therefore sell volatility.

When selling volatility, we have a couple strategy choices, namely selling straddles, strangles, iron condors, ratio spreads, butterflies, or credit spreads. Straddles, strangles, and ratio spreads are short more contracts than they are long and are currently out of reach for our account size. That leaves iron condors (ICs), butterflies/iron flies, and credit spreads. Flies are great when IV is high as ATM options have the highest vega in the chain, but consequently carry more gamma risk. Credit spreads are simple and neat but also inherently carry more delta exposure than I’d like to start off. That leaves us with the IC.

screen-shot-2016-11-30-at-2-14-03-pm

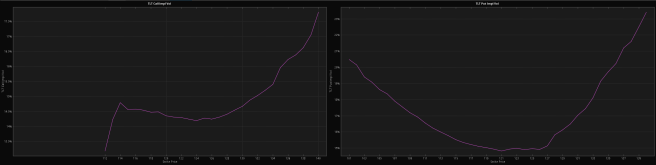
With our underlying and strategy selected, we can take a look at the volatility curve for calls and puts to help decide what strikes we want. With the ATM strikes being 120-121, we can see that ATM to near OTM volatility is fairly flat on the call side and sharper on the put side. Note how call IV doesn’t begin to ramp up until the $124 strike whereas put IV inflects ATM. This means the put strike selection will be more sensitive to volatility as we’ll be buying more volatility on the put side than call side, assuming we stay reasonably close to the money.

For the short strikes, I ended up choosing the closest to 30 delta, which were $117 and $124. This put me in a nice balance between taking in a decent credit and not having to pick long strikes that were too close in to avoid buying a lot of vol. On the long side I went with the $114 and $127 strikes, which happened to be in the 16-18 delta range. Any higher on the call side and I would have been buying a lot of vol, and much lower on the put side and I would have had too much long delta on.

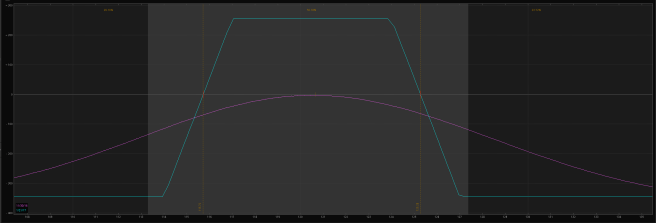
The executed trade payoff graph is shown below, where the blue line is payoff at expiry, the purple curved line is payoff right now, and the percent values at the top are probability zones. This graph can be made/found in the ToS Analyze tab.

screen-shot-2016-11-30-at-2-25-42-pm

That’s about it from start to finish. The GLD IC was put on with similar reasoning.

Today’s Trades (Greeks on Open):

  1. STO 1 Jan17 TLT 114/117/124/127 IC @ $1.27
    • Delta: -0.36
    • Gamma: -3.05
    • Vega: -8.56
    • Theta: 1.11
  2. STO 1 Jan17 GLD 103/106/118/121 IC @ $0.70
    • Delta: -0.85
    • Gamma: -2.68
    • Vega: -7.01
    • Theta: 0.95

The two trades have a combined buying power reduction (BPR) of $300 a piece, which is 12% of our account value per trade. This is higher than I’d like, but with a small account we’re in a tough place with putting on good trades while also keep our risk low.

Visualizing Volatility

In previous posts, I’ve talked a little bit about comparing implied volatility to historical/realized volatility as well as implied volatility to itself. That’s all well and good, but how do we go about actually doing it? I’m a very visual guy, so I cooked up a very simple indicator for my platform (TDA’s ThinkOrSwim) that allows us to see both comparisons cleanly in one window. All I did is take TastyTrade’s IV rank indicator and add the following to the beginning of the ThinkScript:

plot historical= reference historicalvolatility(45)*100;
historical.SetLineWeight(2);

When we put that all together, we get a very powerful study that shows us the current implied volatility compared to the 45 day historical volatility, as well as the current IV rank and IV percentile, which in different ways describe the implied volatility versus itself. I picked 45 days for the HV plot as it is halfway between the 30 and 60 day window I want to use for our options trades. Once you have this study set up, it’s trivial to change that window or add 5, 15 or 30 day HV plots to get a more thorough volatility picture.

Our charts for each of the 10 underlyings we picked earlier look like this:

screen-shot-2016-11-24-at-8-58-23-pm

The price chart is “naked,” meaning void of any technical indicators or S&R levels, and the bottom pane shows 45 day HV (blue line) vs implied volatility, which is colored green when elevated and red otherwise. This simple setup allows us to identify opportunities before we switch over to the options chain and start constructing trades.

In addition to the straight IV/HV and IV/IV comparisons, we will also look at volatility skew. Contrary to what many models predict, (implied) volatility is not the same across strike prices. If it was, we would expect to see a flat IV vs. Strike plot. Instead, we see the following plot for PG calls, which can be found in ToS under Charts–>Product Depth:

screen-shot-2016-11-24-at-8-58-47-pm

This shows us that ATM call IV is lower than OTM call IV, and much lower than ITM call IV. While not terribly interesting in and of itself, we can use these charts to examine when, for example, put IV is richer than call IV, and help us make the best trades given a general volatility assumption.

Between the options chain, our special IV vs. HV / IV vs. IV study, and IV curves, we now have everything we need to start identifying opportunities and placing trades.

Understanding Volatility

Happy Thanksgiving, everyone! I’ve wrote a lot so far about how we will be trading volatility versus price action, and a natural question that might arise is what tools or indicators we will use to identify opportunities. Traders that look to exploit opportunities in price action such as scalpers and trend traders will often use technical support/resistance levels or indicators to make their trades. This is possible because price action behaves differently than volatility. I often hear people refer to instrument prices as “random,” and that’s only sort of true, and leaves out a lot of important subtlety. What is closer to the truth is that instrument returns are random, but even then not in the typical way we use the word “random.”

In literature as well as several popular options pricing models, returns are represented with a type of stochastic process called Geometric Brownian Motion. A stochastic process is one where the variable at time t (i.e. today’s return) is random but also partially dependent on the variable at time t-1 (yesterday’s return). If returns were truly random, with each discrete return being i.i.d., today’s return would have absolutely no effect on tomorrow’s. Anyone that has watched the market for more than a day knows this is not the case, but I will leave the proof as an exercise to my readers.

Volatility, on the other hand, exhibits much different behavior. While it is also often modeled stochastically, volatility exhibits a very special behavior that returns do not: clustering. All clustering means is that while we may see periods of elevated volatility, over time volatility tends to revert towards a long term mean. When people call volatility “mean-reverting,” this is what they are referring to. This clustering behavior is what allows us to trade volatility, and understanding it is crucial to cashing checks.

If we believe volatility clustering to be true, then we also believe that when volatility is especially elevated it will eventually revert to a long term mean. By extension, we also believe that when volatility is priced towards that long term mean, eventually we will see a cluster of higher volatility above that mean. This is the foundation of trading volatility.